Comparison Scores
Introduction - Measuring the Accuracy of Biometric Systems
The accuracy of a biometric system is typically quantified by a “receiver operating characteristic”, or “ROC curve” plot showing the relationship between “false match rate (FMR)” and “false non-match rate (FNMR)” against some biometric sample gallery. The false match rate is the frequency with which biometric samples from different sources are erroneously assessed to be from the same source. In other words, it is the error associated with incorrectly determining that two different individuals are the same individual (falsely matching). The false non-match rate is the frequency with which samples from the same source are erroneously assessed to be from different sources. In other words, it is the error associated with incorrectly rejecting an individual as an impostor (falsely non-matching). These errors are dependent on each other: as one increases, the other decreases and vice versa.
A well-performing biometric system is characterized by prompt results and low rates of false matches and false non-matches. The accuracy of a system corresponds to a point on the ROC curve whose location is a function of the matching “threshold” applied (See Figure). A higher match threshold reduces false match rate but increases false non-match rate (higher security, lower convenience). A lower match threshold reduces the false non-match rate but increases false match rate (higher convenience, lower security); (See Figure). Higher quantities of data (e.g. more fingerprints for fingerprint matching, two irises instead of one for iris matching, etc.) and higher-quality samples yield better performance.
It is important to recognize that biometric system accuracy is highly dependent on the nature of the biometric data in the system. The same algorithm will yield a different ROC depending on the type and quality of the biometric sample data.
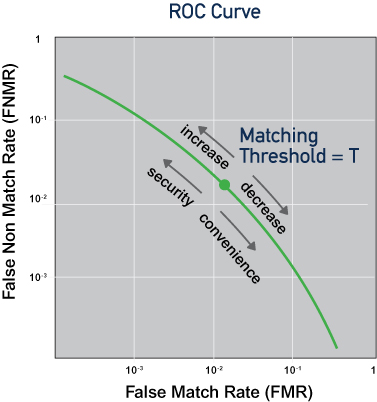
An ROC curve for a given biometric matching system and dataset
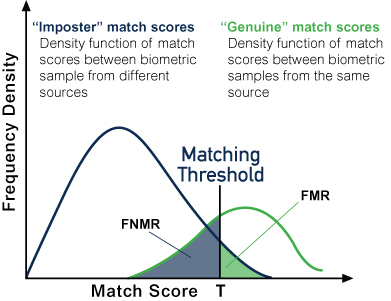
Density functions of comparison scores between a) samples from different sources and b) samples from the same sources, illustrating FMR and FNMR.
Interpreting Biometric Comparison Scores
Characterizing the result of a single biometric comparison or search requires a paradigm that is different from one characterizing the behavior of an entire biometric system; it involves expressing a binary result for our comparison (genuine or impostor).
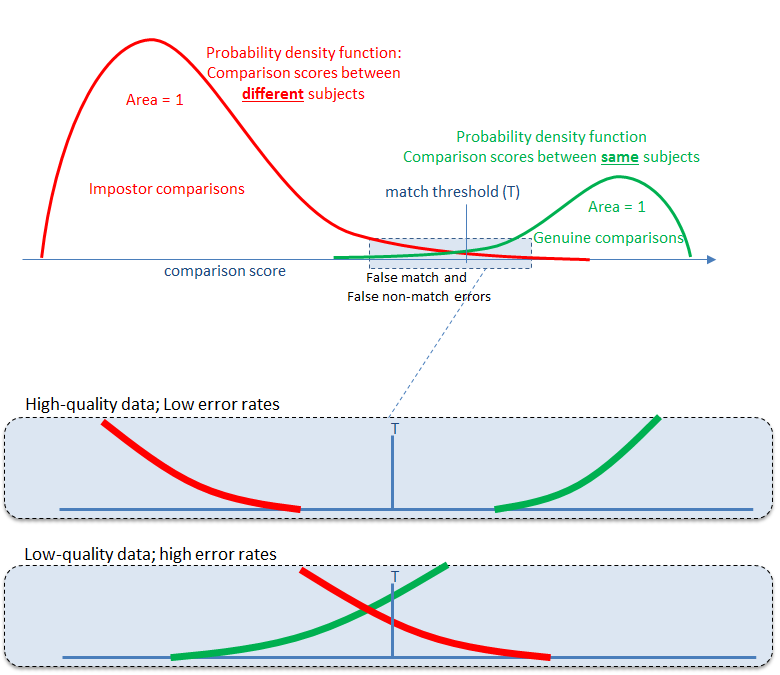
When we perform a biometric comparison, we generate a comparison score. Generally, a higher score reflects a higher likelihood that the two samples (or sets of samples) are derived from the same source. However, various imperfections in the biometric systems and samples virtually assure that there is always at least some likelihood that two samples are actually not derived from the same source, even though their comparison score is higher than some matching threshold (i.e. a false match). For example, as the size of a cache increases, there is an increasing likelihood that any given person will have someone in the cache that looks like them and will subsequently have a comparison greater than the set threshold, resulting in a false match. Similarly, we are also assured that in cases where the comparison score is below our threshold that there is some probability that the two samples are in fact derived from the same source (i.e. a false non-match). For example, a person who has aged, or grown facial hair may look very different from their gallery image, resulting in a very low comparison score and a false non-match.
The figures below illustrate the source of false match and false non-match errors in biometric comparisons; it shows that sometimes comparison to an impostor yields comparison scores above our threshold, and also that sometimes comparison to a genuine yields comparison scores below our threshold.
Comparison Scores
Nexa Scores
The Nexa biometric search and match SDK generates various scores to help users interpret results for verification and identification processes. The following sections will describe the core comparison score and its variants.
Nexa Comparison Score
The comparison of two biometric samples results in a comparison score “s” that quantifies their similarity. A user can apply a threshold to this score based on the characteristics of their operational environment (e.g. desired false match rate, desired false non-match rate, gallery data quality, cache size, etc.) in order to adjust overall system performance. The Nexa comparison score is scaled and calibrated in a way that enables a user to directly relate a threshold selection to the likelihood of any particular comparison yielding a false match, i.e. an instance where a comparison score should indicate a genuine match (based on the selected threshold) but the match is actually a match to an impostor.
Through empirical testing and mathematical modeling, the comparison score has been calibrated and scaled to result in a value that is defined logarithmically, in terms of false match rate (FMR) by the base-10 logarithm:

such that the likelihood that an accepted match with that comparison score (for a given gallery size) is actually a false match can be estimated using the following equation:

Furthermore, it follows that a given gallery size implies a minimum comparison score. For example, for a gallery size of 1 million the formula implies that a score of 6 is all but guaranteed, since (1 million) / 106 = 1 (probability of 100%). In other words, for any given search in a gallery of 1 million subjects, there will be at least one comparison score greater than or equal to 6.
Further still, it follows that a given gallery size implies the expected frequency of a given comparison score, given some arbitrary biometric sample probe. For example, as noted above, for a gallery size of 1 million, we would expect a score of 6 or higher to occur once every search (FMR is 1 in 106), a score of 7 or higher to occur once every 10 searches (FMR is 1 in 107) and a score of 8 or higher to occur on the order of once every 100 searches (FMR is 1 in 108), etc.
We can use this scoring definition to set a score threshold towards achieving a desired target
false match rate for a verification application. For example, if the desired threshold is an FMR
of 1 in 10,000, then the comparison score genuine threshold should be set at  .
.
Note that the comparison score is defined only in terms of false match rate, so it does not imply what the false non-match rate would be. The false non-match rate depends on a given application’s image quality. See Figure.
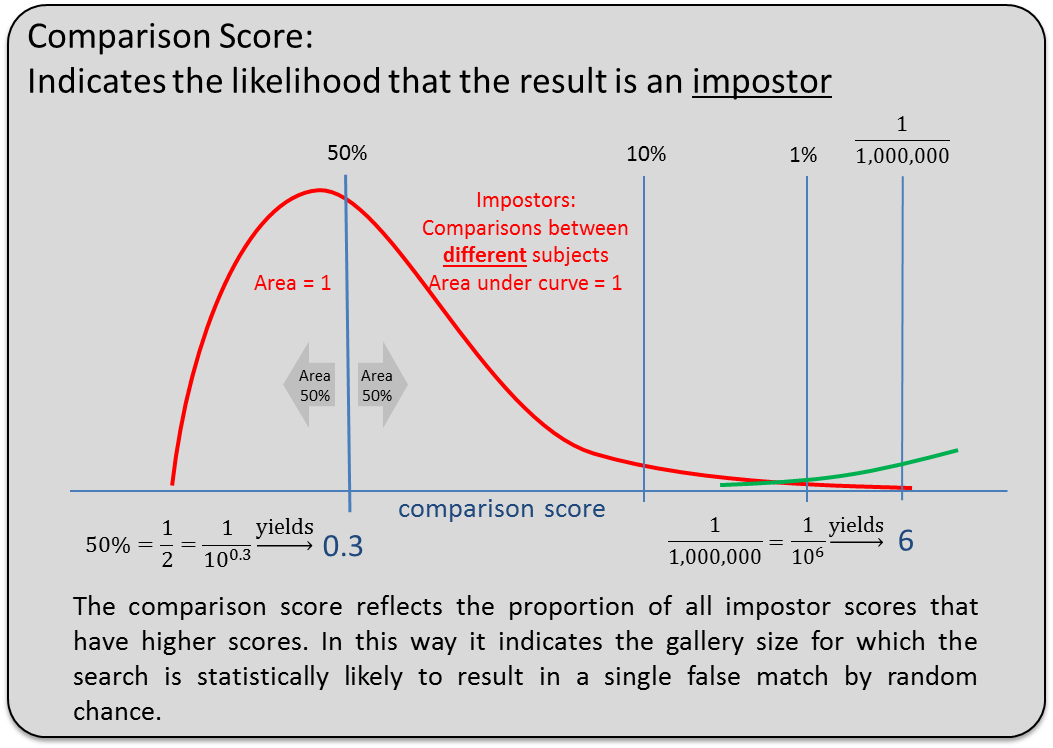
Comparison Score: likelihood that the result is an impostor.
Setting Match Thresholds
For verification matching (1:1), a score threshold that corresponds to an FMR of 1 in 10,000 is typical.
Therefore a score threshold of  would be used for this case.
In the context of identification both a score and a score FMR are available. The score is analogous to the 1:1 score, but is modulated somewhat to include information from matching the gallery. To provide a score that can be compared against a threshold, the score is decreased by logarithm of the gallery size. As a result of this modification, the score provides a false positive identification rate (FPIR) rather than a false match rate (FMR). The difference is that FMR is evaluated on a one to one basis, whereas FPIR is evaluated on a one to N basis. FMR tells you whether any one probe and impostor comparison will result in a false positive. As a result, the rate that a probe will return a false match increases with the size of the cache. This is where FPIR comes in, it keeps the rate that probes return a false match constant as the cache grows.
The score FMR is a lower level score that does not include modifications based on the gallery. This score is provided only for use in data fusing operations.